Astronomy
& Science
Look up. Ask why.
Follow the evidence.
Start with a surprising question. Explore the Moon, exoplanets and black-hole images; try a small experiment; then discover the instruments and people behind the evidence. Choose your path: curious reader, student or amateur observer.
Six questions worth passing on.
Make a prediction before opening an answer. Then ask what evidence supports it. Each question has its own link, so you can send the part that interests a friend or a class.
Are we seeing the stars as they are now?
No: light needs time to reach us. Sunlight takes about 8.3 minutes to travel to Earth. A light-year is a distance, not an age. For a nearby star described as 100 light-years away, we receive light that travelled for roughly 100 years. 10
Your turn: Try explaining the difference between the age of a star and the travel time of the light you see.
Follow this question →Is the far side of the Moon always dark?
No. The near side and far side both experience sunlight and darkness as the Moon rotates. Our changing view of its illuminated half produces the familiar phases; Earth's shadow is involved in a lunar eclipse, not in the ordinary monthly sequence. 11
Your turn: Draw a Moon illuminated from one side. Change the position of the observer, not the light source.
Follow this question →Can a planet be detected without a separate photograph?
Yes. A star's changing radial velocity can reveal a companion. A transit offers another clue: a small dip when a planet crosses the star as seen by us. Neither a single dip nor a single shift is enough on its own to establish a planet. 1
Your turn: Compare the motion measurement in the chapter with the brightness calculation in the transit lab.
Follow this question →Are the colours in Webb images real or invented?
Webb observes infrared wavelengths our eyes cannot see. Image specialists map those measurements to visible colours. This translation lets us examine real data; it does not mean our eyes would see the same scene in those colours. Read the filter information and caption before interpreting a colour. 12
Your turn: An image can be based on observations without representing natural colour as seen by a human observer.
Follow this question →How can we image something from which light cannot escape?
The EHT image of M87*, released in 2019, shows emission surrounding a dark shadow. It is reconstructed from radio observations, not a visible-light snapshot of the interior of a black hole. What is measured is light from the surrounding region; the black hole shapes the pattern. 13
Your turn: Look at the image below. Which part is bright, which part is dark, and what does the caption actually claim?
Follow this question →Does a planet in the habitable zone have life?
That conclusion does not follow. The term concerns conditions under which surface liquid water might be possible; atmosphere and other planetary properties still matter. A planet's location alone establishes neither a habitable surface nor the presence of life. 14
Your turn: Keep three claims separate: in the habitable zone, actually habitable, and inhabited.
Follow this question →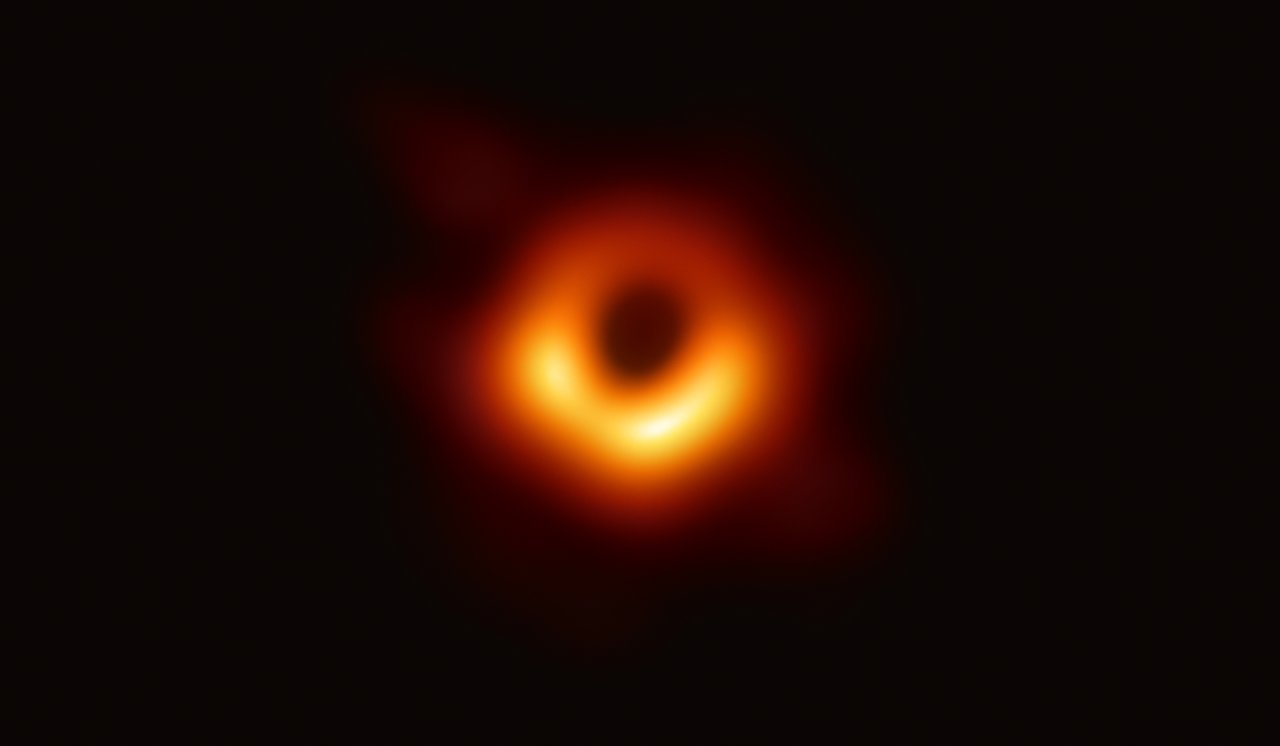
Observation, reconstruction or illustration?
Observation-based image: ask which instrument and wavelengths produced the measurements.
Reconstruction or processed composite: ask how measurements were combined and how colour was assigned. Processing is not, by itself, fabrication. 12 13
Artist’s concept: useful for communicating an idea, but not evidence of the depicted surface or detail. NASA’s Eyes tutorial identifies its close views of exoplanets as artist concepts. 20
Turn one look at the Moon into a small investigation.
Choose a clear night when the Moon is visible. Begin with your eyes; use binoculars only if you already have them and know how to use them safely. NASA notes that lunar terrain can be easier to distinguish outside full Moon, especially near the boundary between light and dark. 15
Draw before naming.
From a safe, accessible place, sketch the illuminated shape and two or three obvious features. Mark what you actually see, not what a reference picture suggests should be there.
Write down the conditions.
Record date, local time and time zone, general observing area, equipment and cloud conditions. Keep private addresses out of anything you share publicly. Our template below is a learning aid, not a calibrated measurement system.
Compare another evening.
Return when the Moon is visible again. Compare illumination and shadows, then distinguish what changed in the view from what you can claim changed on the surface. Use the official guide to interpret the difference. 11 15
Open the observation-notebook template
Copy this into a notebook. Nothing is uploaded or stored by this page.
Target:
Date / local time / time zone:
General observing area (no home address):
Equipment, if any:
Sky and cloud conditions:
What I directly observed:
My sketch or photograph:
My interpretation:
One alternative explanation:
What I will compare next time:
Source used for checking:
Official reference: NASA Moon viewing tips ↗. The exercise sequence above was prepared for Stadia.
How much starlight could a planet hide?
A transit can produce a small dip in a star’s measured brightness. 1 In this idealised model, an opaque circular planet is fully in front of a uniformly bright stellar disc. The blocked fraction is the ratio of their apparent areas:
Static example: 10%. The table and explanation work without JavaScript.
Teaching model only: no limb darkening, partial overlap, blending, atmosphere, noise or stellar variability. It does not calculate an orbit, timing, mass or habitability and it does not fit real transit data.
Check the numbers without the interactive control
| Radius ratio | Light blocked | Light remaining |
|---|---|---|
| 1% | 0.01% | 99.99% |
| 5% | 0.25% | 99.75% |
| 10% | 1% | 99% |
| 20% | 4% | 96% |
Try it: double the radius ratio from 5% to 10%. The ideal blocked fraction becomes four times larger, not twice as large: area depends on radius squared.
The important next question: could a different cause produce a brightness dip? Compare this simple model with the evidence checklist before treating a pattern as a planet.
No telescope? There are still ways to take part.
Choose one route, follow the project’s tutorial and requirements, and check the current availability of tasks. These links leave Stadia. Follow each project’s account and age requirements; younger learners should work with a teacher or parent. A contribution is not a guaranteed discovery, publication, certificate or payment.
Exoplanet Watch
NASA’s project supports transit observations and light-curve analysis. Participants without a telescope can request an existing observation to work on. Follow the project’s contribution workflow, which may involve observer registration and external software/accounts. 17 18
Explore Exoplanet Watch ↗Planet Hunters TESS
Learn to recognise patterns in brightness measurements from the TESS mission. Volunteers inspect light curves and flag possible features for investigation. A flagged transit-like feature still needs follow-up; it is not a confirmed planet. 19
Read the project guide ↗NASA’s Eyes
Use the official tutorial to explore known planetary systems and the methods used to detect them. Read the data and captions: close-up planet surfaces in the viewer are artist concepts, not photographs from a probe visiting those worlds. This route is exploration, not data submission. 20
Open the Eyes tutorial ↗How an optical instrument makes an astronomical discovery possible
A planet can reveal its presence through the motion of its star, even when we do not obtain a separate picture of the planet. This chapter follows the radial-velocity method: the question, the instrument, the measurement and the checks that make an interpretation credible. 1
Look for a changing spectrum, not a photograph of the planet.
A star and an orbiting planet both move around their common centre of mass. We can look for the part of the star’s motion directed toward or away from us. That line-of-sight component is its radial velocity. 1
As the star approaches, spectral features move toward shorter wavelengths; as it recedes, they move toward longer wavelengths. This is the Doppler effect. The shifts being measured are not a dramatic visible change in the star’s colour. 9
HARPS: engineering for repeatable measurements.
HARPS stands for High Accuracy Radial velocity Planet Searcher. It receives light through optical fibres from ESO’s 3.6-metre telescope at La Silla. The spectrograph separates that light for precise comparison of spectral features. 9
The ESO instrument overview describes a design aimed at long-term radial-velocity accuracy of about 1 m/s. Mechanical stability, thermal control and a vacuum enclosure help reduce instrumental changes that could move the recorded spectrum. 2
Instrument figures from ESO’s overview, not a promise of accuracy for every star or exposure. Resolving power is not a reflectivity percentage. 2

The detector records a spectrum. Analysis turns it into evidence.
The ESO detector example shows why a spectrograph is not an ordinary camera. A long spectrum is arranged into shorter orders on the detector. Calibration features provide a reference for locating wavelengths. 3
Very small velocity signals can correspond to a tiny fraction of a detector pixel. NASA’s description of the NEID spectrometer illustrates why this demands stability throughout the instrument, rather than merely a sharp image. 4
Four questions to ask of a result
- What quantity was actually measured?
- How was its scale calibrated?
- What uncertainty accompanies the value?
- Which checks could expose an instrumental change?
A reading checklist for this chapter, not a substitute for an instrument’s reduction and calibration procedures.
Ask what must remain stable, and how it will be verified.
Consider these as engineering questions when reading a specification. They are not advertised capabilities of HARPS, a coating supplier or a particular historical mirror.
Reflectivity
At which wavelengths, angle of incidence and polarisation is a reflectivity value specified? Does the figure refer to a minimum, an average or one measurement?
Thermal behaviour
Does a temperature range describe survival, continued operation or measured optical stability? What cycling, duration and allowable drift are included in the acceptance test?
Durability & substrate
Which hardness or resistance test is agreed? How will the substrate, surface quality and coating be evaluated together, rather than through a single headline figure?
Worked example: why several reflections matter
Synthetic optical budget. Assume ten identical reflections, each with reflectivity R = 99.5%, all at the same agreed wavelength, angle and polarisation. Ignore every other loss.
About 95.1% of the incident light remains after those reflections. This multiplication is an idealised example, not a measured throughput or a specification for HARPS. A reflectivity figure alone cannot certify thermal stability or durability.
This learning series discusses requirements, performance and verification. Proprietary coating compositions, layer sequences and fabrication processes are not disclosed.
A repeating signal is a reason to investigate, not the end of the argument.
A companion is not the only explanation to test. Stellar activity can affect the measured spectrum: ESO highlights the diagnosis of starspots as a way to guard against false planet detections. 5
An instrument also needs checks against drift. HARPS’s stable design and reference spectra address that part of the problem; they do not remove the need to study the star. 2 5
Ask whether the proposed model explains the observations and their uncertainty, whether competing explanations have been examined, and what independent observation would strengthen or weaken the interpretation.
A discovery connects a question, a reliable measurement and a tested interpretation.
That is why astronomy also needs optical engineering, calibration, careful analysis and transparent reporting.
One scientific ambition. Several different paths.
These projects are related by the pursuit of better measurements, not a single sequence of replacements. Historical milestones and future objectives are identified separately. Public sources checked 25 September 2026; this is not a live operational-status page.
HARPS-N
Telescopio Nazionale Galileo, La Palma
A closely related precision radial-velocity instrument in the Northern Hemisphere, built to discover and characterise planets using Doppler measurements, including follow-up of transiting candidates. 21
Discuss: What can a new observing site add without changing the basic measurement method?
ESPRESSO
Very Large Telescope, Paranal
ESO describes ESPRESSO as HARPS's successor. It combines stable spectroscopy with the VLT and can receive light from one or all four Unit Telescopes. First light is a milestone, not a statement of the uncertainty attainable for every observation. 22
Discuss: How do light collection, spectral information and calibration address different limits?
NIRPS
ESO 3.6-metre telescope, La Silla
NIRPS observes in the near infrared alongside HARPS, with simultaneous operation on the same telescope. ESO gives 1 April 2023 as the start of operations. This is a complementary wavelength range, not simply a replacement for visible-light spectroscopy. 23
Discuss: Why compare two wavelength ranges when evaluating a possible planetary signal?
HARPS3
Isaac Newton Telescope, La Palma
The Terra Hunting Experiment plans repeated observations over at least ten years with HARPS3 and a robotic telescope. Its current notice expects the survey to start in 2027 after a cryostat failure during commissioning in June 2026. This remains a forecast, not a guaranteed date or an already completed survey. 24
Discuss: Why do the spacing and duration of observations matter as well as precision?
ANDES / ELT
Extremely Large Telescope, Cerro Armazones
Formerly ELT-HIRES, ANDES is planned for high-resolution studies including exoplanet atmospheres, early stars and fundamental physics. These are research goals. The consortium reported submission of the system Preliminary Design Review documents in June 2026, with the review meeting then expected in late October. 25 26
Discuss: How do a science goal, an engineering requirement and a verified performance result differ?
Project-team schedules can change; follow the linked notices before planning observations. These public summaries do not attribute components or contracts to an individual supplier. Personal engineering case studies will be documented separately. No institutional partnership or endorsement is implied.
Try the reasoning yourself.
These exercises are part of this page. Use paper or a calculator, then open each worked solution. They do not require an account, payment or an external app.
Exercise A · How small is a Doppler shift?
IDEALISED CALCULATION · NOT AN OBSERVATIONFor line-of-sight speeds much smaller than the speed of light, use the first-order Doppler relation below. In this exercise, positive velocity means motion away from the observer.
Assume λ0 = 500 nm, vr = +30 m/s and c ≈ 3 × 10⁸ m/s. Calculate the wavelength shift. Is it toward red or blue?
Show the calculation and its meaning
Δλ ≈ 500 × 30 / (3 × 10⁸) nm = 0.000050 nm = 0.05 pm.
The shift is positive: the wavelength becomes longer, toward red. The model wavelength is about 500.000050 nm. This is arithmetic within the stated approximation, not the precision claimed for a real measurement.
For comparison, at a resolving power of 115,000, λ/Rspec at 500 nm is about 0.00435 nm, roughly 87 times this shift. The width of a resolution element and the precision of locating a spectral shift are different quantities. Real precision depends on the information in the spectrum and the measurement system; shifts may be much smaller than a pixel. 2 4
Exercise B · A pattern is not yet a planet.
SYNTHETIC VALUES · NO REAL STAR · NO MEASUREMENT ERRORS MODELLEDThe following values were generated for this lesson from the idealised function v(t) = 12 sin(2πt/8), with t in days and v in m/s. The zero point is arbitrary. No noise, activity or instrumental drift has been added.
| Time (days) | Relative velocity (m/s) |
|---|---|
| 0 | 0 |
| 2 | +12 |
| 4 | 0 |
| 6 | −12 |
| 8 | 0 |
| 10 | +12 |
| 12 | 0 |
| 14 | −12 |
| 16 | 0 |
- What are the period and semi-amplitude of the generating model?
- What are the maximum, minimum and peak-to-peak velocity?
- Could these points alone establish that a planet exists? What would you ask to see next?
Show the solution and the limits of this example
The generating model has a period of 8 days and a semi-amplitude of 12 m/s. The maximum is +12 m/s, the minimum is −12 m/s and the peak-to-peak change is 24 m/s.
Because we supplied the generating function, we know what this teaching model does. If we had only the sparsely sampled points, a unique model would not follow automatically: other time behaviour can pass through the same points.
No planet has been detected in this exercise. For a real target, request uncertainties, observation times, calibration checks, observations at additional times and tests for stellar activity. Do not infer a planet’s size, habitability or an exact mass from this table.
Discussion · What changes if the instrument drifts?
Imagine adding an unknown wavelength offset to every observation. Before interpreting that change as motion of the star, ask how an independent reference would reveal the offset. Then ask the complementary question: which changes originate in the star and would not appear in the calibration source? This separates instrument testing from interpretation of the target.
Six statements. What would you question?
Decide true or false before revealing the answer. Explain your reasoning; there is no account, scoreboard or certificate.
1. A light-year measures time.
2. The far side of the Moon never receives sunlight.
3. One repeating dip proves the existence of a planet.
4. Webb's visible colours can encode infrared measurements.
5. Doubling the planet radius doubles the ideal transit depth.
6. You must own a telescope to contribute to Exoplanet Watch.
One subject. Two ways to explore it.
For curious readers
Read the four stages and inspect the photographs. You can skip the equations without losing the main idea: the measurement and the interpretation are not the same thing.
Try explaining why a spectrograph can help find a planet even when the detector image does not show the planet.
Return to the explanation ↑For a classroom discussion
Suggested level: upper-secondary or introductory undergraduate physics. Adapt to the group; this is not an accredited course.
Prerequisites: wavelength, speed, ratios and scientific notation. Suggested session: 30–45 minutes, including discussion.
Learning goals: calculate a small shift, distinguish semi-amplitude from peak-to-peak change, and explain why a model needs independent checks.
Open the exercises ↑Suggested teaching sequence and assessment prompts
- 5 minutes: ask what could reveal a planet without a separate image.
- 10 minutes: inspect the instrument photograph and open the linked detector image. Identify observation, reference and interpretation.
- 15 minutes: complete Exercises A and B before opening their solutions.
- 5–15 minutes: discuss an alternative explanation and propose one useful follow-up check.
Ask each learner to write three separate sentences: what was measured, what model was proposed and what remains untested. Assess the distinction between these statements, not merely the numerical answer.
Four useful terms.
- Radial velocity
- The component of relative velocity along the line of sight, not the full speed through space. 1
- Spectrum
- A representation of light separated by wavelength. A spectrum is not the same as a picture of the sky. 3
- Resolving power
- Here, Rspec = λ/δλ describes spectral resolution. Do not confuse it with a mirror’s reflectivity R. 2
- Calibration reference
- A reference used to establish or check the measurement scale. The comb features in the linked detector image are a wavelength-reference example. 3
Scientific sources & image credits.
The original HARPS chapter is retained. New curiosity, observing and participation sections use the public sources linked below; instrument-family summaries use official project documentation. Activities, quizzes and numerical examples are teaching material prepared for Stadia, not newly acquired astronomical data. Source review: 25 September 2026.
- 1 · NASA ScienceHow We Find and CharacterizeRadial-velocity detection and the distinction from other ways of finding planets.
- 2 · ESO instrument documentationHARPS instrument overviewInstrument design, telescope, vacuum enclosure, reference spectra and resolving power. No claim here that HARPS is the most precise instrument currently available.
- 3 · ESO observation imageA raw spectrum, straight from HARPSPublic explanation of the detector image and the calibration features. Image credit: ESO.
- 4 · NASA ScienceNEID: A New, Ultra-Precise Window into Nearby WorldsA separate instrument illustrating the need for stability when shifts correspond to fractions of a pixel. NEID is not HARPS.
- 5 · ESO, 2010 announcementHARPS polarimetry and stellar activityWhy investigating starspots matters when checking a candidate signal. Historical announcement; its superlatives are not presented here as current rankings.
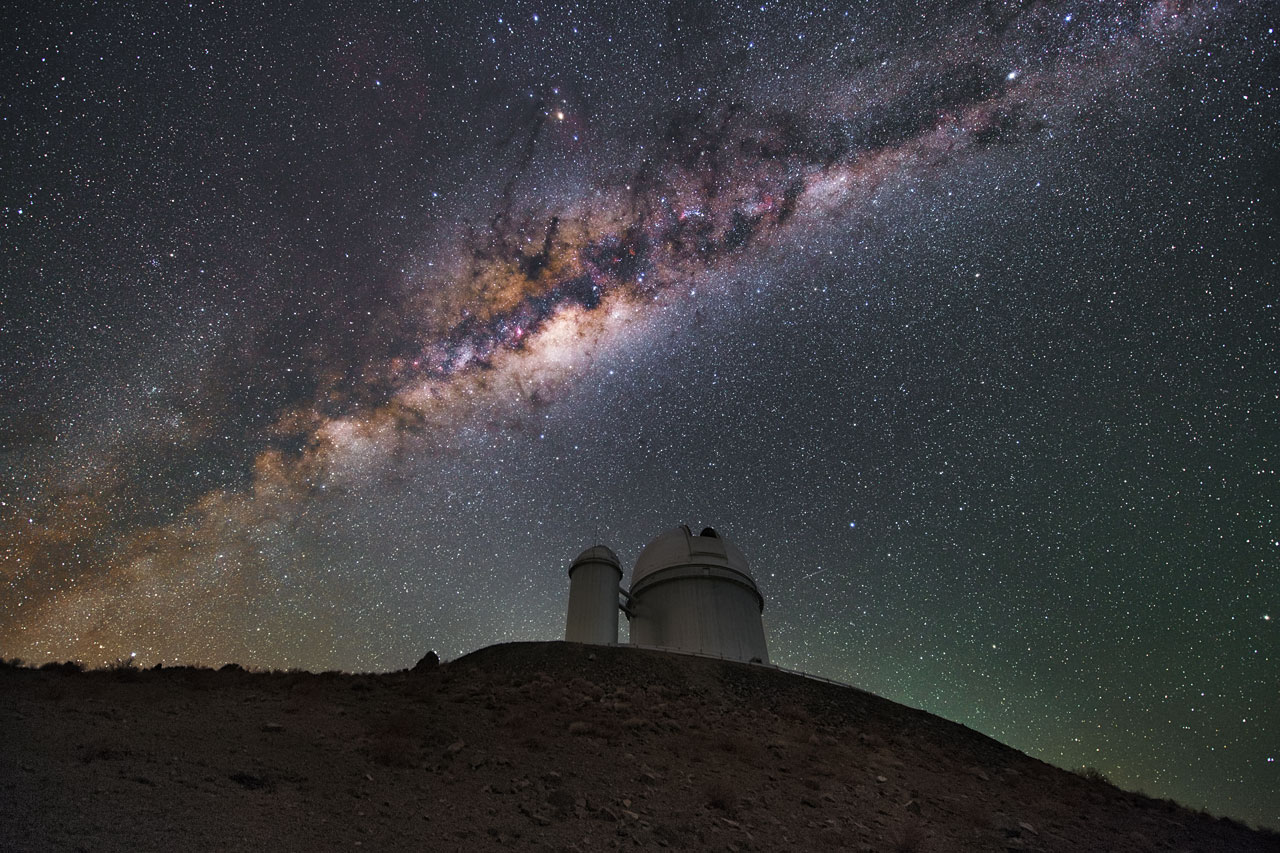
- 6 · Observatory photographESO 3.6-metre telescope and the Milky WayCredit: Y. Beletsky (LCO)/ESO. Displayed proportionally without intentional crop; published by ESO in 2014.
- 7 · Instrument photographThe HARPS spectrograph during laboratory testsCredit: ESO. Displayed proportionally without intentional crop; published by ESO in 2003.
- 8 · Image-use conditionsESO copyright noticeImages used under Creative Commons Attribution 4.0, with credits visible beside each image. Attribution does not imply partnership or endorsement.
- 9 · ESO public instrument guideHARPS and the radial-velocity methodInstrument identity, telescope and explanation of spectral shifts. Technical values used in the exercises follow the science overview in source 2.
- 10 · NASA Space PlaceWhat is a light-year?Light travel time and looking into the past. Historical record claims in the original article are not repeated as current records.
- 11 · NASA ScienceTop Moon questionsWhy the far side is not permanently dark; phases are not ordinary shadows cast by Earth.
- 12 · NASA / STScIHow are Webb full-colour images made?Infrared observations mapped to visible colours. An assigned colour is not evidence that an image is fabricated.
- 13 · ESO / EHT CollaborationFirst image of a black holeM87* image released on 10 April 2019; radio emission around the shadow. Image credit: EHT Collaboration. Displayed in its original proportions under the ESO image-use terms in source 8.
- 14 · NASA, 17 April 2014Habitable zone does not establish habitabilityThe historical Kepler-186f announcement explains why location alone does not determine surface conditions. We do not present being in this zone as evidence of life.
- 15 · NASA ScienceMoon viewing tipsNaked-eye and binocular observations; lunar shadows and the terminator. The activity here is our suggested exercise, not a NASA-run course.
- 16 · NASA ScienceSolar observing safetyNever use unfiltered optics on the Sun. Eclipse glasses and ordinary sunglasses are not a substitute for a proper front-mounted solar filter on an optical instrument.
- 17 · NASA ScienceExoplanet WatchReal transit observations and analysis. Data can also be requested without owning a telescope. Participation, availability and validation are controlled by the project.
- 18 · NASA ScienceExoplanet Watch: how to contributeExternal steps, observer registration and EXOTIC workflow. These are not services hosted by Stadia.
- 19 · NASA SciencePlanet Hunters TESSLearn to inspect real light curves. A flagged feature is a candidate for follow-up, not a confirmed discovery or a promise of credit.
- 20 · NASA / JPL-CaltechEyes on Exoplanets tutorialExplore systems and observing methods. Planet surfaces in the viewer are artist concepts, not close-up photographs of the planets.
- 21 · University of GenevaHARPS-N project overviewNorthern Hemisphere counterpart at the TNG. Public instrument history, not supplier attribution.
- 22 · ESO, 6 December 2017ESPRESSO first lightESPRESSO as the successor to HARPS at the VLT. The announcement date is distinguished from a statement about present observing availability.
- 23 · ESO, 4 April 2023NIRPS starts operationsScience operations from 1 April 2023 and simultaneous near-infrared observations with HARPS.
- 24 · Terra Hunting ExperimentHARPS3 / Terra Hunting project statusThe team forecasts a 2027 survey start after the June 2026 cryostat failure. Checked on 25 September 2026; this is not a guaranteed date.
- 25 · ESO ELTANDES, formerly ELT-HIRESA planned ELT spectrograph, not an instrument already producing the discoveries set out in its science goals.
- 26 · ANDES consortium / INAFANDES development milestones30 June 2026: system PDR documents submitted; review meeting expected in late October. No completed review or operational date is inferred.
Stadia Science · Explore, observe & share · Version 3.0 · 25 September 2026.
Independent educational material, not an accredited course. Cited institutions and citizen-science projects are external sources, not Stadia partners or endorsers. No payment, account or new data collection is required by this page. Translation depends on the site’s existing language system; only the supplied English content is included here.