Eyes & senses
of space missions.
How do we turn the invisible into evidence?
Block a star. Read a landscape. Time a pulse. Sort particles. Follow the instrument from a scientific question to a measurement you can trust.
A beautiful image is a beginning.
What does it actually tell us?
A useful starting habit is to ask four questions of every scientific image: What was measured? By which instrument? How was it processed? Which conclusion does it support? In this chapter, keep an observation separate from an interpretation, and both separate from an artist’s impression.
Light can be reflected, transmitted or absorbed; its interaction with matter depends on wavelength. Instruments exploit those differences to select information rather than simply to make a scene brighter. [1]
- QuestionChoose something that could be answered by a measurement.
- InstrumentDecide which signal can carry the information.
- MeasurementCalibrate, record conditions and estimate uncertainty.
- InterpretationCompare explanations and state what remains unresolved.
To see more,
start by hiding the brightest light.
Can receiving less light give us more useful information?
Metis is a coronagraph on Solar Orbiter. By blocking the bright solar disc, it allows the much fainter corona — the Sun’s outer atmosphere — to be recorded. It observes visible and ultraviolet emission. The published first-light images use assigned colours to distinguish the bands; the colours are not a naked-eye view. [2]
This is a lesson in contrast. Collecting more unwanted light may bury a weak signal. An optical design must control stray light and choose which wavelengths reach the detector. [1][2]
Think first: does the black centre mean the Sun is missing?
No. In these coronagraph images the central region is deliberately blocked. A missing signal can be a consequence of the instrument rather than the absence of the object.
 Observation · assigned colours
Open the official image and caption (opens in a new tab)
Can a filter improve the measurement?
Imagine one exposure containing 100 signal counts and 900 background counts. A hypothetical filter transmits 80% of the signal and 10% of the background. These numbers are invented for learning; they are not a Metis or coating specification.
Purple: useful signal. Grey: background. Before filtering the useful fraction was 10%.
Worked solution · signal fraction is not the whole answer
Signal: 100 × 0.80 = 80. Background: 900 × 0.10 = 90. The useful fraction is 80 / (80 + 90) = 47.1%.
Under an ideal, photon-counting model with independent Poisson counts, a known mean background and no read-noise or dark-current contribution, a simple signal-to-noise estimate is S / √(S + B). It rises from 3.16 to 6.14 for these default values. A real background estimate adds its own uncertainty. Losing too much signal can make the measurement worse even while the useful fraction rises.
Challenge: keep 10% of the signal and 0% of the background. The useful fraction becomes 100%, but only ten signal counts remain. Explain why “all useful” does not mean “precise”.
No software? The default numbers and worked solution remain readable without JavaScript.
 Observation · processed colour
Open the official image and caption (opens in a new tab)
A landscape is also a dataset.
Can an image tell us what a rock is made of?
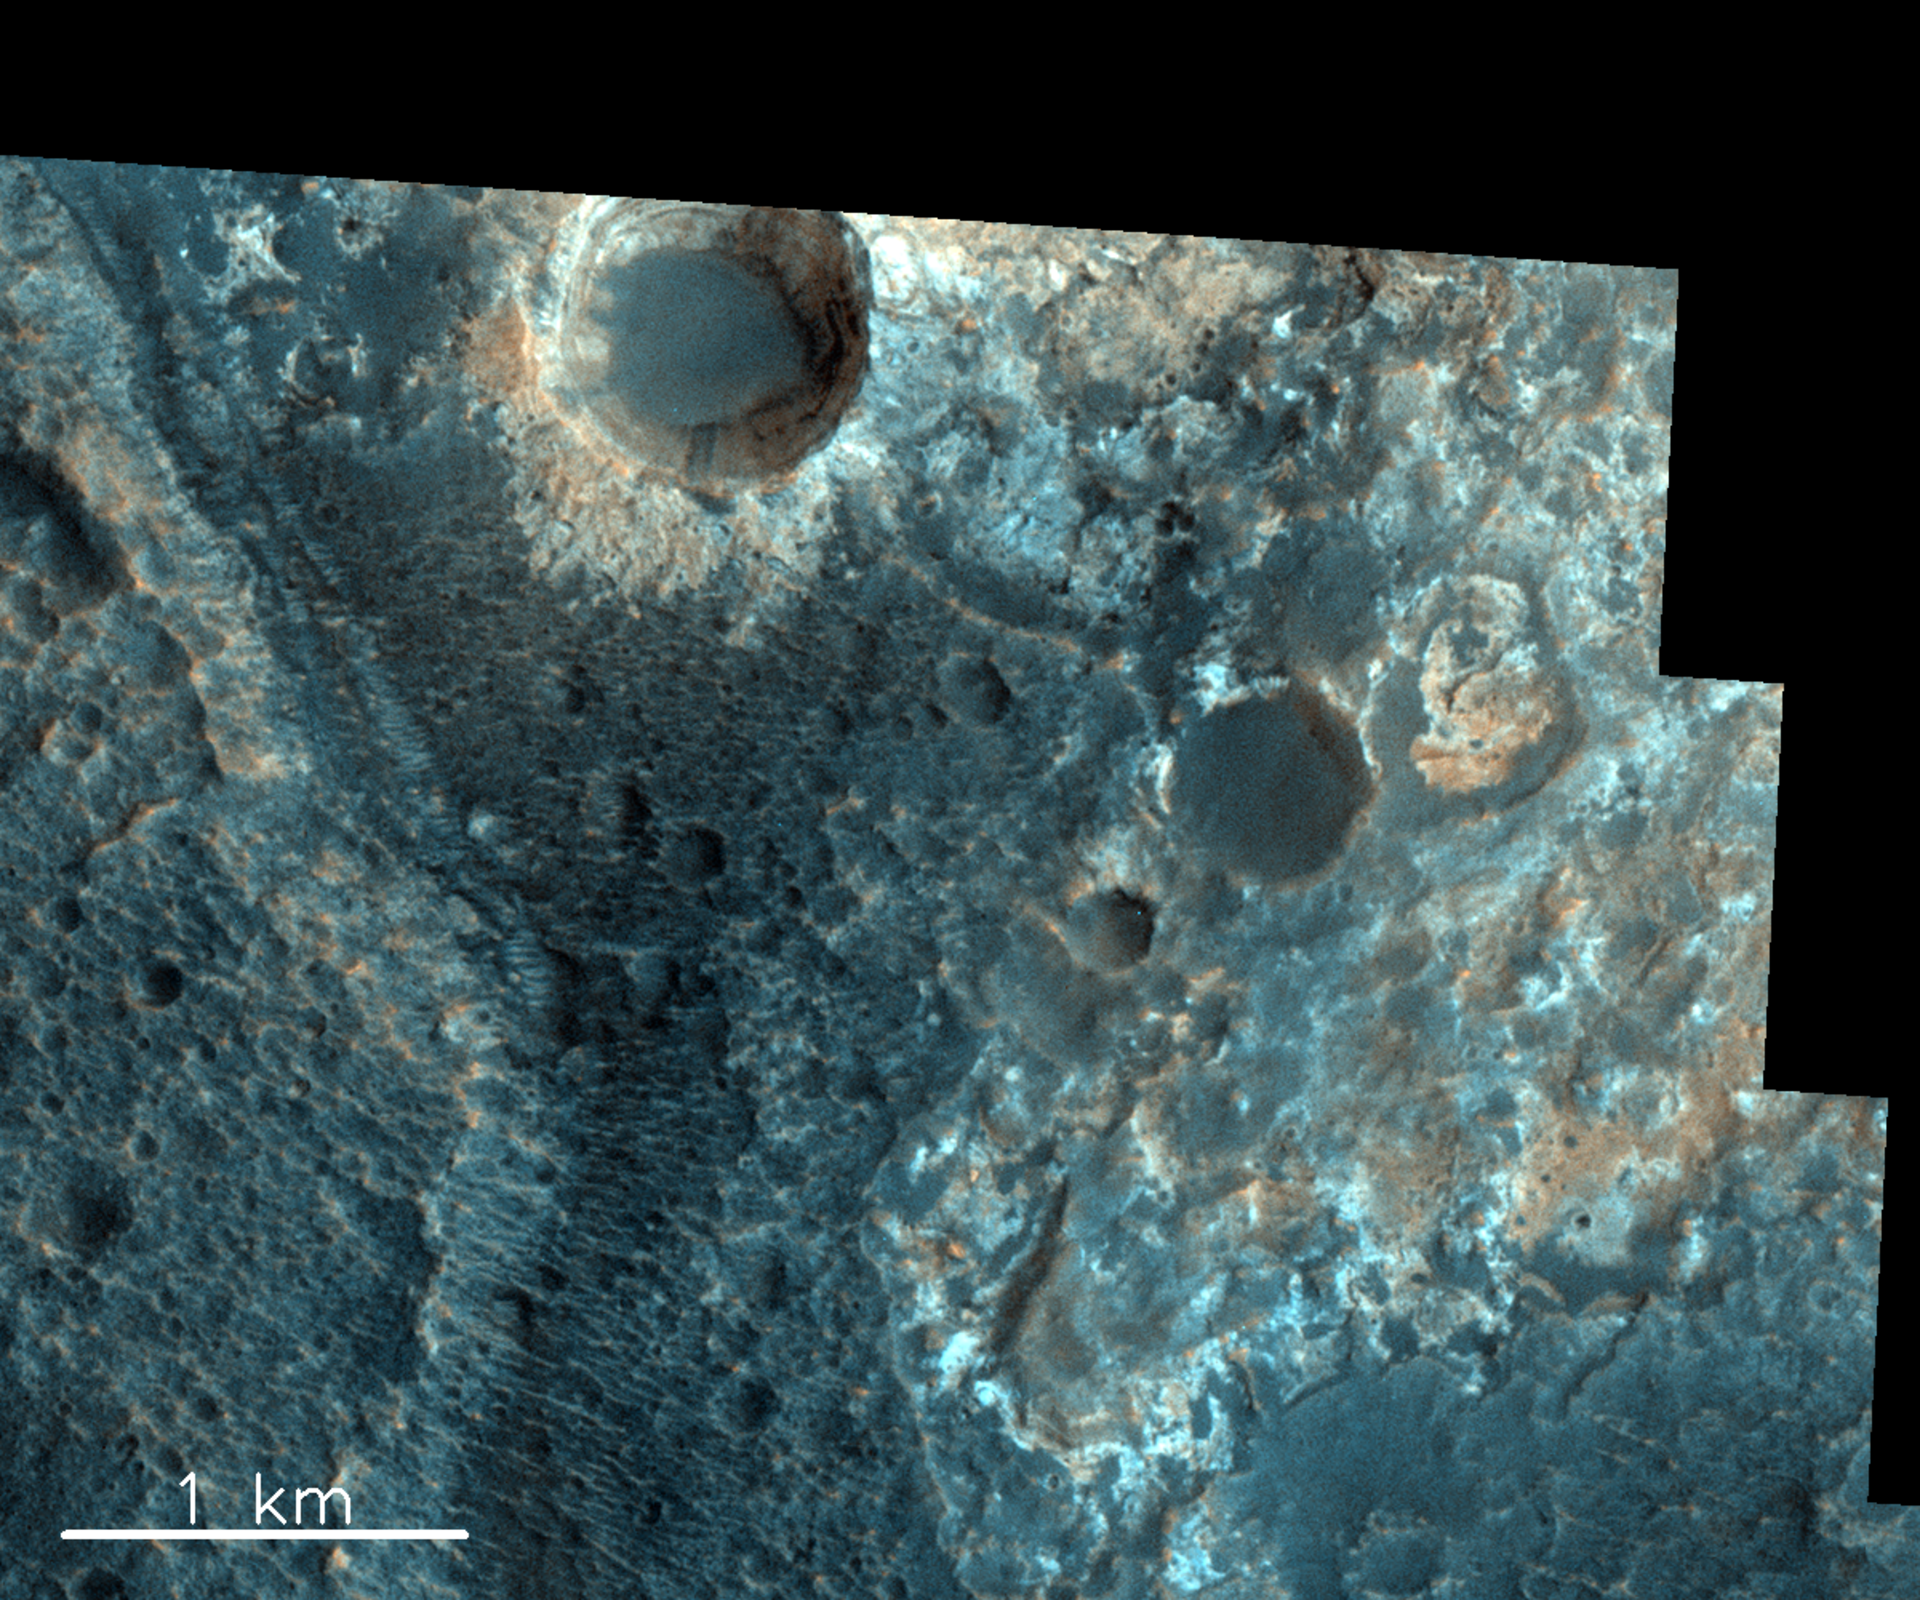
CaSSIS — the Colour and Stereo Surface Imaging System — is a camera on the ExoMars Trace Gas Orbiter, developed under the leadership of the University of Bern. It images the surface; it is not the instrument that directly analyses atmospheric gases. [3]
Its coloured views combine measurements through filters. Stereo observations view terrain from different geometries, allowing relief to be reconstructed. The instrument team also calibrates and assembles small image framelets into the final view: a scientific image is a processed measurement, not an unexamined camera output. [5]
For Oyama Crater, the source compares CaSSIS terrain patterns with mineral information from spectrometers on other spacecraft. This is a useful example of combining evidence, rather than declaring a mineral from one displayed colour. [4]
A safe desk activity: your two viewpoints
Hold a thumb at arm’s length in front of a distant indoor object. Look with one eye, then the other, keeping your head still. The apparent displacement illustrates parallax. Repeat with the thumb closer. This is an analogy for the geometry of stereo imaging, not a method for calculating a Mars height from these pictures.
The observation browser is external and requires JavaScript. The university site is a text-based alternative.
Turn a clock
into a ruler.
How can a light pulse measure a planet?
BELA, the BepiColombo Laser Altimeter, measures the time between an emitted laser pulse and its detected return from the surface. A receiving telescope, narrow-band filter and detector help distinguish the return from unwanted light. [6]
The elapsed time describes a round trip. In a simple model, distance is the speed of light multiplied by time, divided by two. A range is not yet a terrain map: spacecraft position and pointing, calibration and a reference shape are also needed. [6]
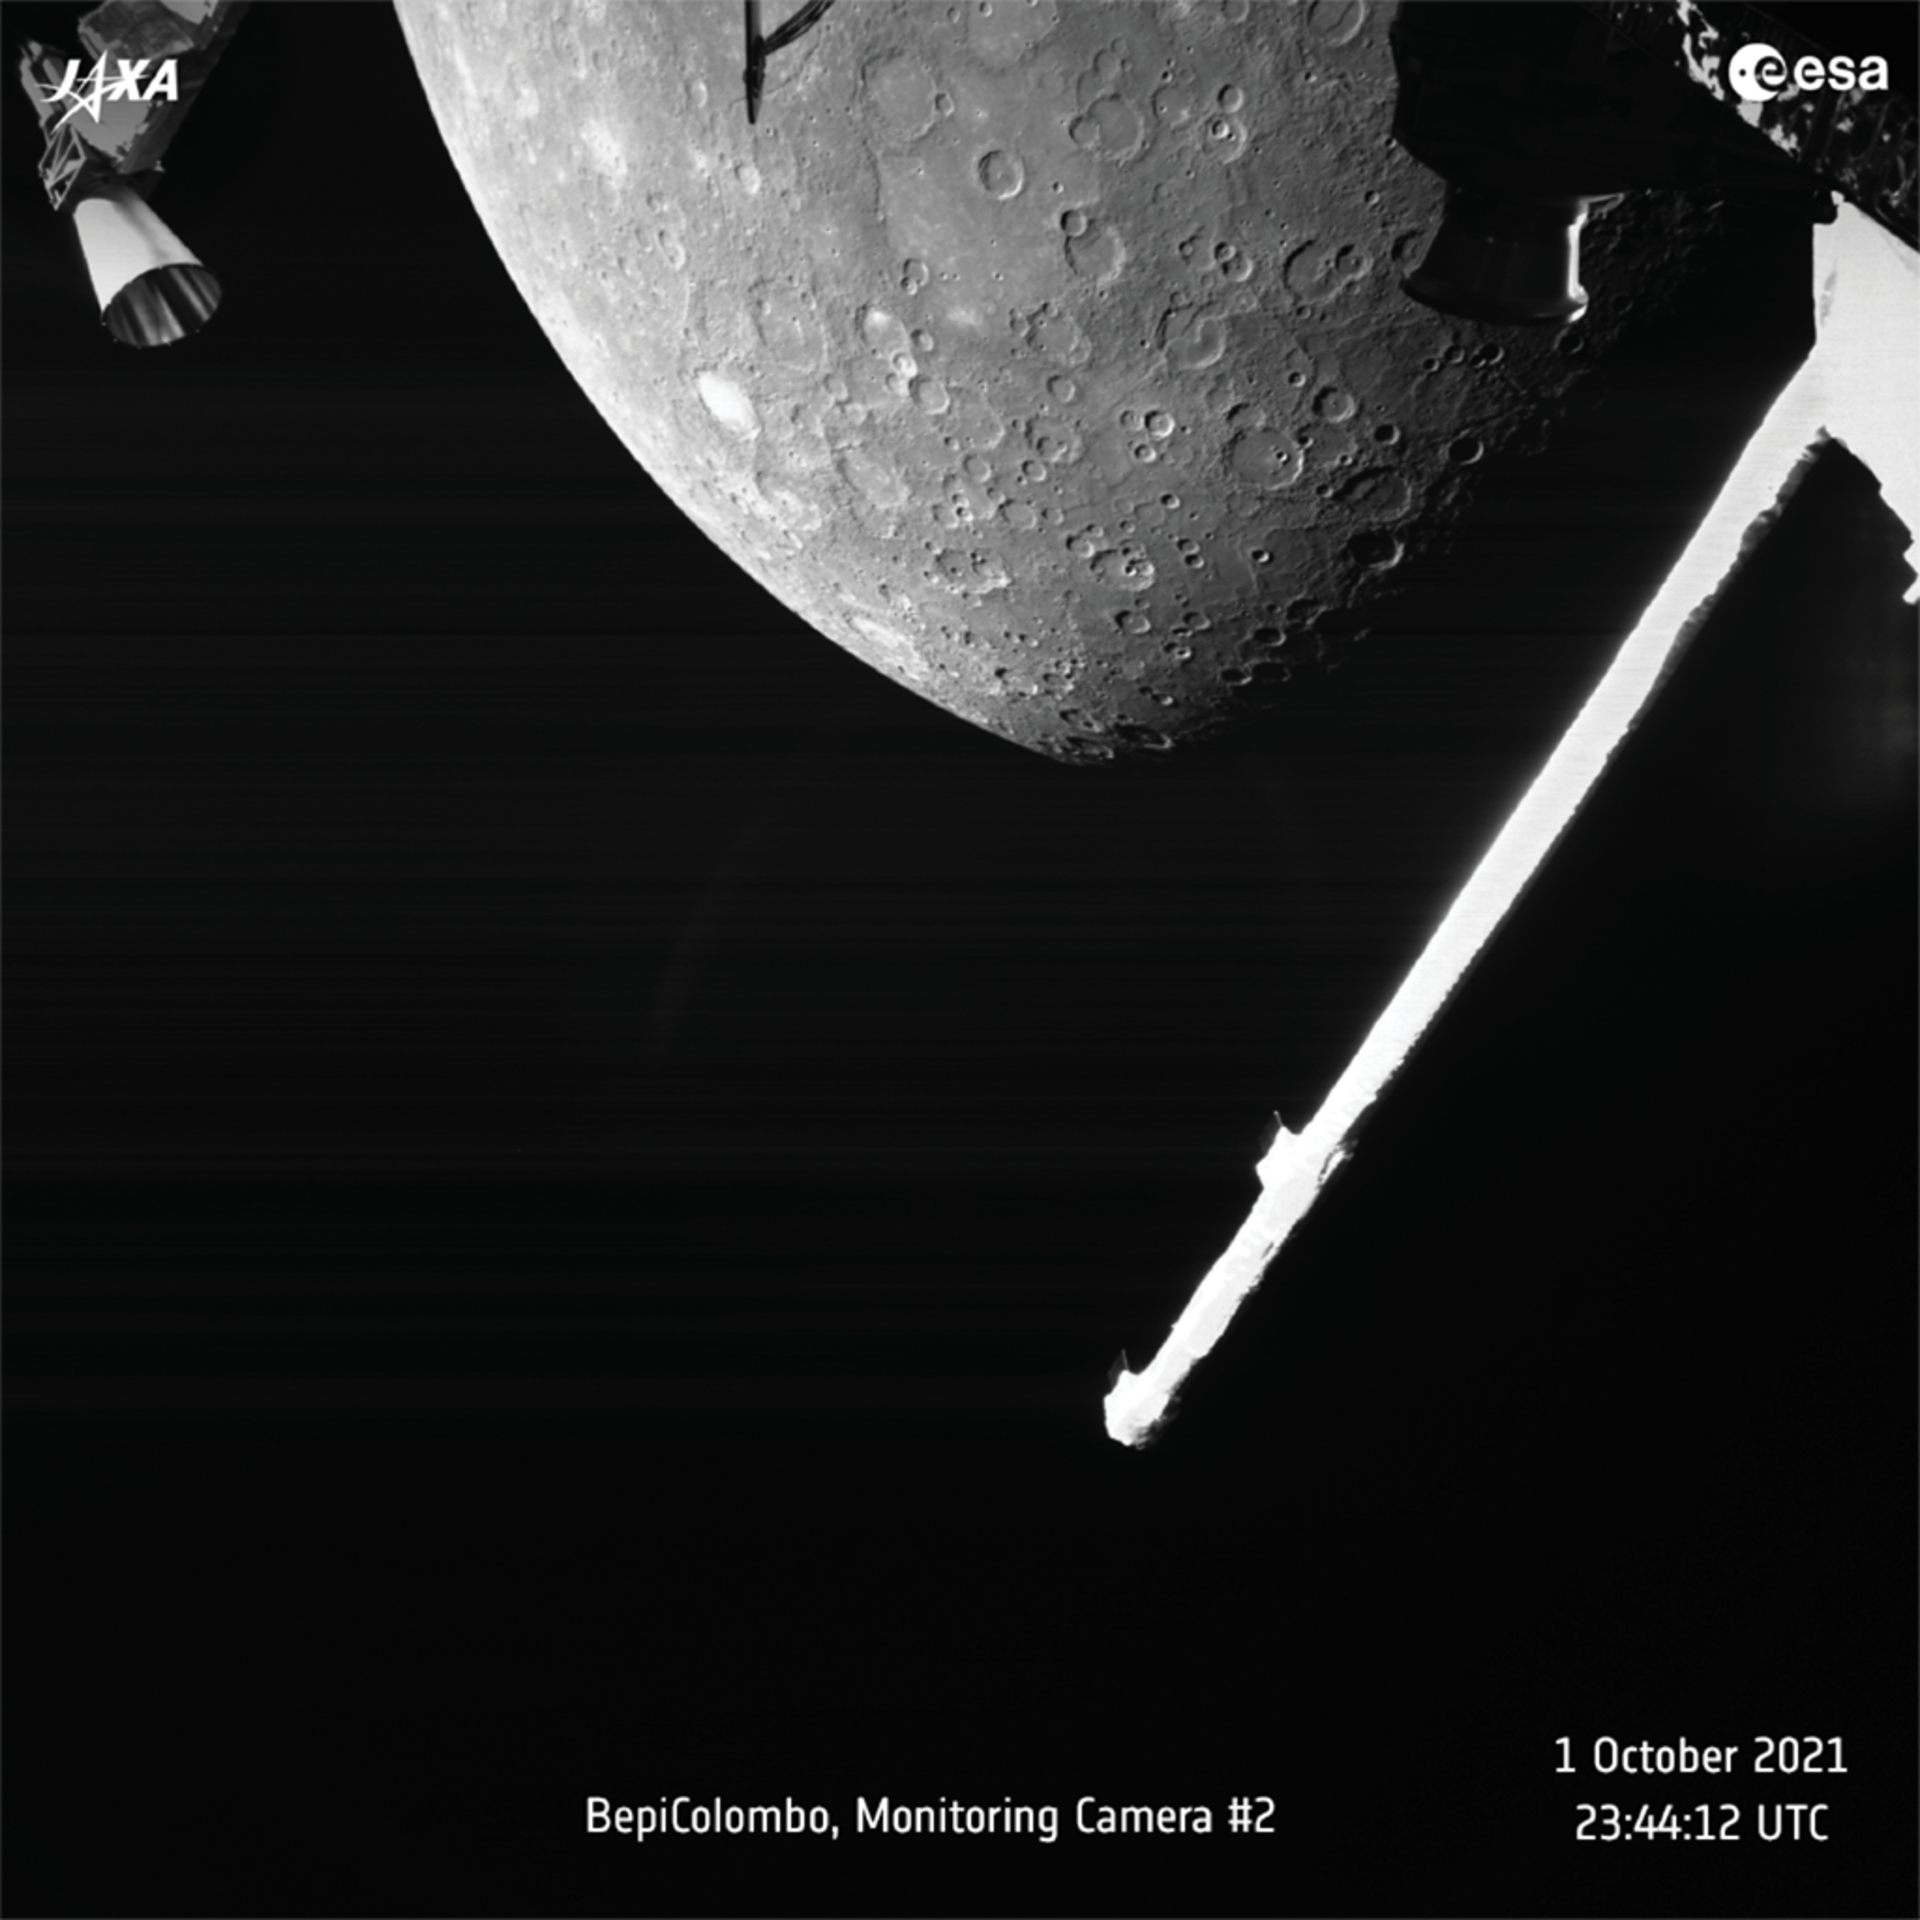
The photograph beside this text was taken by a BepiColombo monitoring camera, not by BELA. Different instruments on one mission answer different questions. [7]
Why does a filter help an altimeter?
The useful return is in the laser’s wavelength band. A filter can reduce other incoming wavelengths. That does not remove all background, and the design must allow for the instrument’s operating conditions.
 Observation · monitoring camera
Open the official image and caption (opens in a new tab)
Measure a distance with milliseconds
Use the rounded classroom value c ≈ 300,000 km/s. Assume a stationary instrument, a straight path and no instrumental delay. This calculator is not a BELA flight-data tool.
Other uncertainty sources are intentionally omitted.
Worked solution and the missing information
4 ms = 0.004 s. Therefore 300,000 × 0.004 / 2 = 600 km. For 2 ns, the timing contribution is 300,000,000 × 2 × 10−9 / 2 = 0.30 m.
That 0.30 m is not total map accuracy. Ask about orbit knowledge, pointing, surface slope, return-pulse shape, calibration and the chosen reference surface.
Not every spectrum is made of light.
How do you sample the very thin gas around a moon?
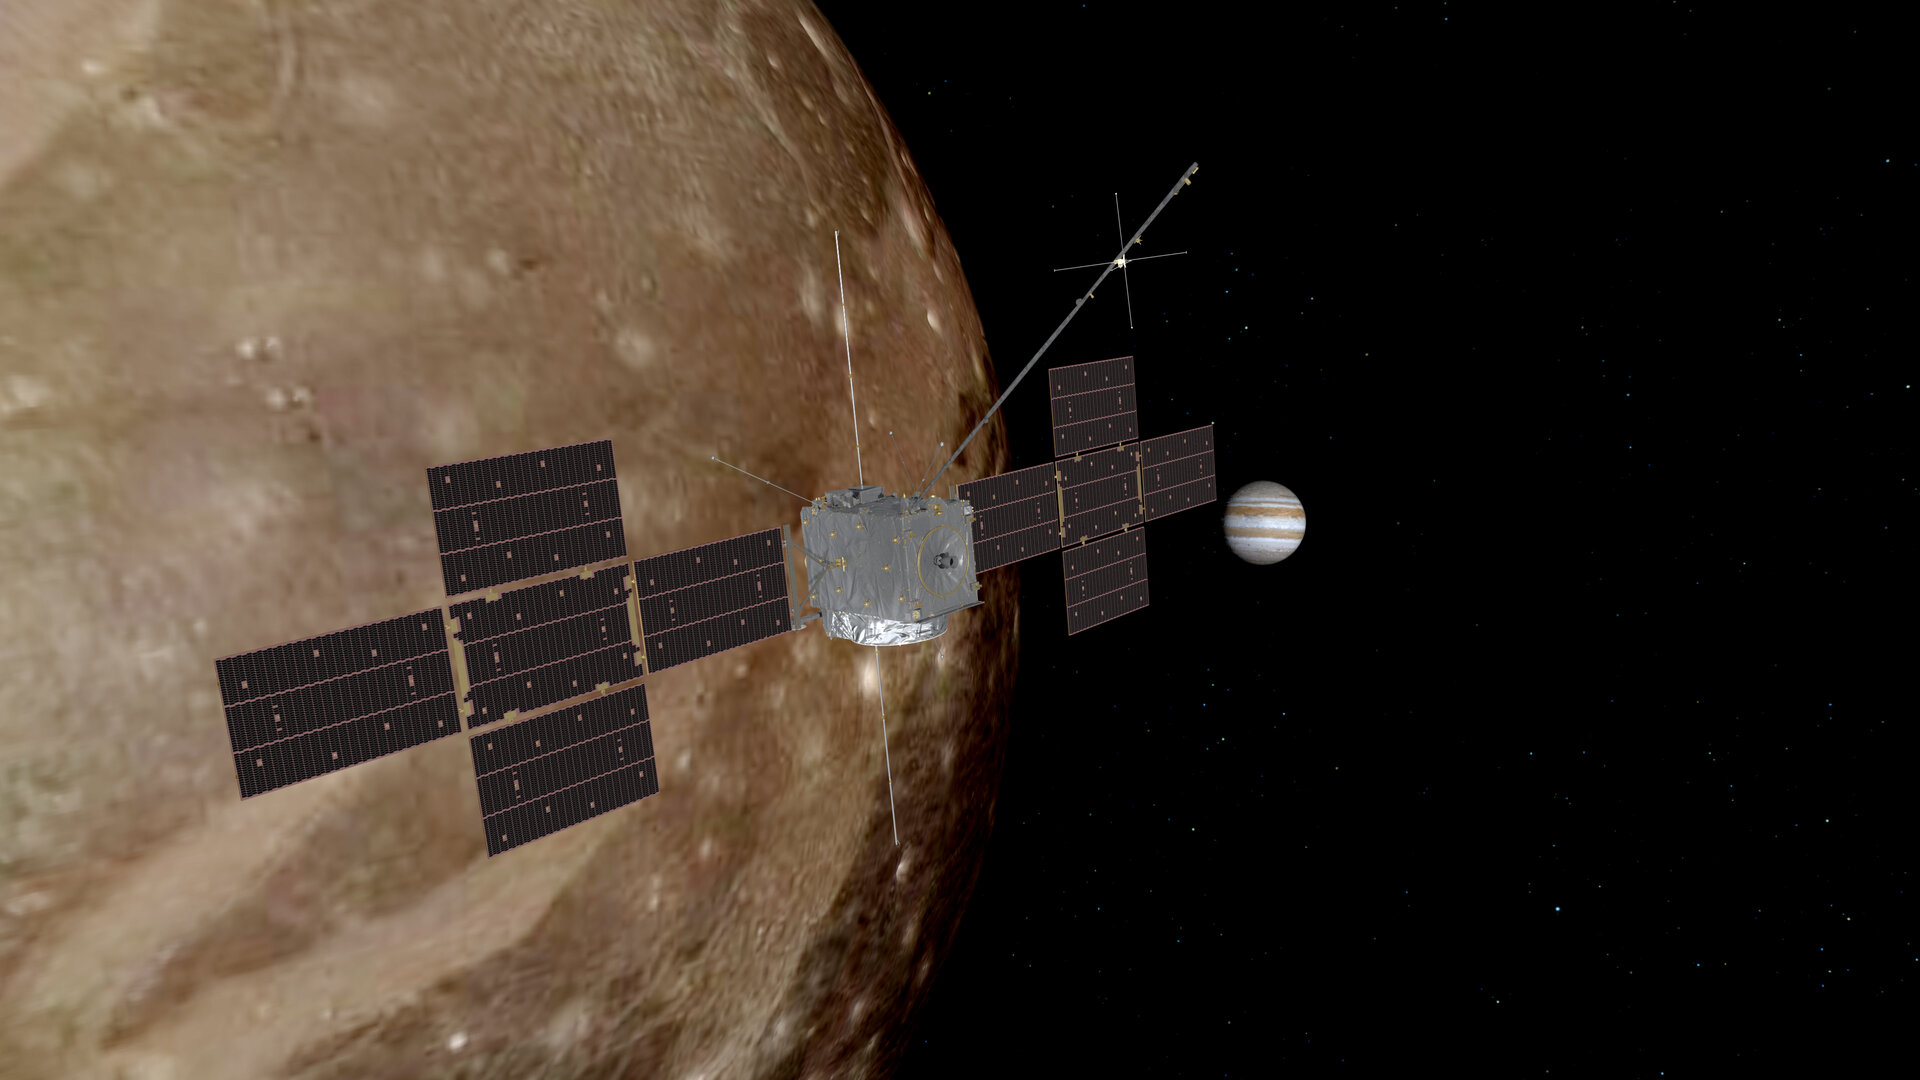
Juice is designed to study Jupiter and the icy moons Ganymede, Callisto and Europa. Its instruments do not all take photographs. The Bern-led Neutral and Ion Mass Spectrometer, NIM, is part of the Particle Environment Package and is designed to analyse tenuous neutral gas and ions. [8][9]
For neutral samples, an ion source creates charged particles. An analyser separates them by mass-to-charge ratio, and a detector records arrival times. The ion mirror in this instrument uses electric fields: it is not a reflective optical coating. [8]
- SampleLet atoms and molecules enter the instrument.
- Ionise & guideCreate or collect ions and guide their motion.
- SeparateUse time of flight to distinguish mass-to-charge ratios.
- RecordConvert arrival-time signals into a calibrated mass spectrum.
A mass peak must be interpreted with calibration, possible overlapping species and the instrument response in mind. An instrument concept is not, by itself, evidence of an ocean’s composition or of life.
Which ion arrives first?
Give two ions the same charge, accelerate them through the same voltage, and compare equal flight paths. In this simplified non-relativistic model, flight time is proportional to the square root of mass-to-charge ratio. Ignore starting velocity and energy spread.
Why twice the time, not four times?
The acceleration supplies kinetic energy qV = ½mv². Solving gives v = √(2qV/m). Since t = L/v, time scales as √(m/q). A fourfold mass-to-charge ratio gives a twofold time, not fourfold.
NIM has a more sophisticated ion-optical design. This model illustrates a principle and should not be used to simulate its calibration or resolution.
Use the atmosphere
as part of the detector.
What reaches the mirror when the original gamma ray does not?
A high-energy gamma ray interacting in the atmosphere can produce an air shower. Charged secondary particles moving faster than light travels in that medium produce a brief Cherenkov flash. They do not outrun light in a vacuum. [10]
Cherenkov telescopes collect the resulting light, not the original gamma ray. Fast cameras record the flash; multiple views and analysis help reconstruct the shower and distinguish candidate gamma-ray events from backgrounds. [10]
The same phenomenon at CERN
LHCb uses ring-imaging Cherenkov detectors, or RICH detectors, for particle identification. Here the medium and detector geometry are engineered in a particle experiment rather than provided by the atmosphere. A shared physical effect does not make these the same instrument.
[11]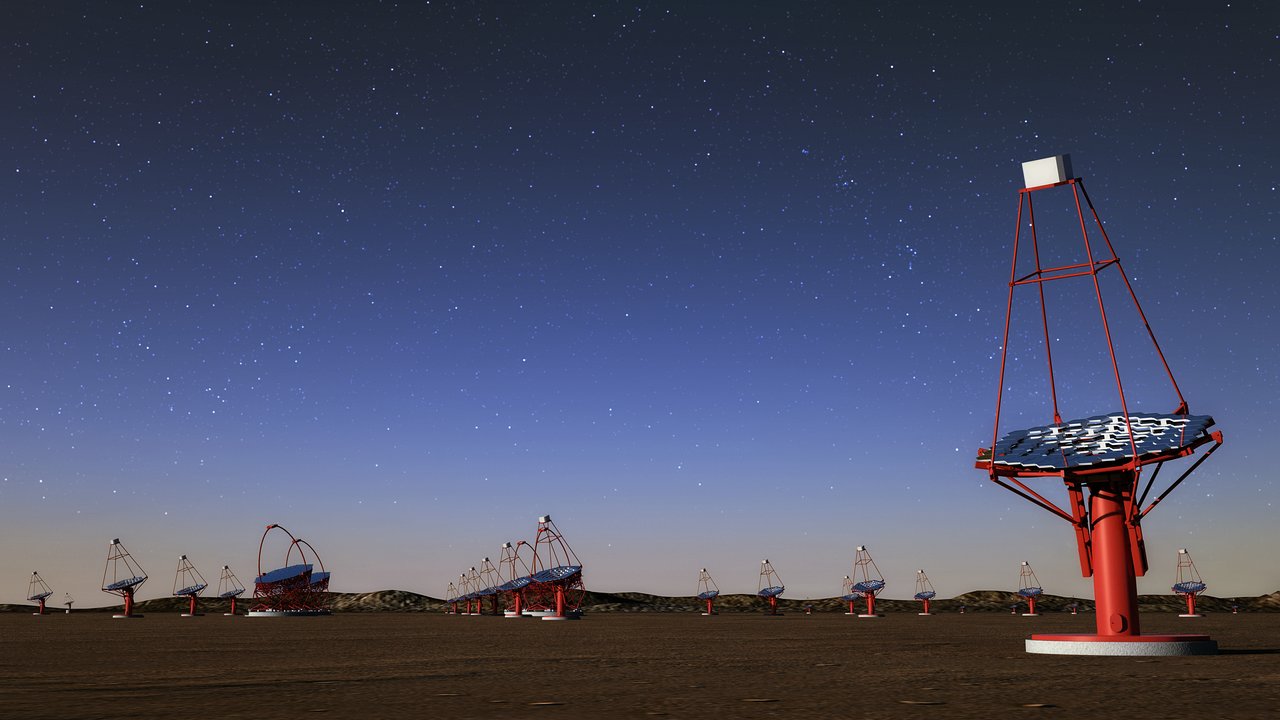
A layer is not a label.
It is a set of measured properties.
Reflection, transmission and electrical behaviour are different requirements. NASA has investigated transparent conductive coatings that dissipate electrical charge while preserving useful optical transmission. That is a public example of a design trade-off, not a claim about a particular supplier or mission component. [12]
A useful classroom question is not “Does the surface look clear?” but “Which properties have actually been measured, under what conditions?” Passing an optical check does not by itself establish an electrical or environmental requirement.
Even a single functional layer may require substantial development. Its qualification must be tied to a defined use, with acceptance criteria specified before testing.
Same transparency. Same component?
For this exercise only, require visible transmission of at least 85% and sheet resistance no greater than 50 Ω/□, both before and after a specified laboratory test. All values below are synthetic; they describe no TFP product and no mission requirement. Measurement uncertainties are omitted from this introductory decision.
| Sample | Transmission before → after | Sheet resistance before → after |
|---|---|---|
| A | 90% → 90% | 40 → 70 Ω/□ |
| B | 88% → 87% | 35 → 38 Ω/□ |
| C | 91% → 83% | 30 → 31 Ω/□ |
Which sample passes this limited check?
B passes both stated thresholds before and after the test. A retains its optical transmission but fails the electrical threshold. C remains electrically acceptable but fails the optical threshold.
This does not make B space-qualified. We would still need uncertainty estimates, repeatability, a defined test procedure and all the other requirements. Near a threshold, measurement uncertainty affects whether conformity can be claimed.
 Observation · performance check
Open the official image and caption (opens in a new tab)
Test what you built.
Then ask what can be transferred.
The JANUS camera on Juice took images of Earth during the 2024 flyby primarily to evaluate instrument performance. The scene was familiar; the measurement was still valuable. A real target can help test a system before it reaches its main destination. [14]
Visible and infrared channels can reveal different aspects of the same scene. Thermal-infrared imaging is sensitive to emitted radiation; other infrared observations also involve reflected light. Interpreting a picture requires knowing the band, the detector and the conditions. [13]
According to the engineer’s account, some expertise from astronomical work was later applied to a terrestrial prototype. The learning question is what must be re-tested when the use changes — not whether a space-related origin guarantees performance on Earth.
Discuss the responsibility as well as the technology
A remote observation system can support environmental monitoring, but observing people also raises privacy questions. In a classroom, use landscapes, published data or non-personal targets. Do not collect or publish identifiable images of people without an appropriate basis and permission.
A film library, not a scrolling distraction.
Choose one short film before opening the longer documentary. Each link goes to the institution’s own page. The written question lets you take part even when audio or captions are unavailable.
No player starts automatically. Language, subtitles and accessibility options depend on the external host. Historical films may mention plans that have since changed; use the current mission pages for schedules.
A solar observation needs geometry
Watch how a spacecraft trajectory is placed within the Metis field of view.
Open official film page ↗ (opens in a new tab)Exploring Mars from orbit
A guided collection of CaSSIS surface images, published in 2020.
Open official film page ↗ (opens in a new tab)How CTAO will see the high-energy Universe
An introduction to atmospheric showers and Cherenkov-light telescopes, published December 2025.
Open official film page ↗ (opens in a new tab)The making of Juice
Optional long-form viewing: follow development, testing and launch.
Open official film page ↗ (opens in a new tab)Juice and Ganymede in 17 seconds
A cinematic animation of the intended encounter, not flight footage at Ganymede.
Open official film page ↗ (opens in a new tab)Roman’s starlight-suppression technology
The page contains an official video and background on masks and deformable mirrors.
Open official film page ↗ (opens in a new tab)LHCb: the Beauty Experiment
A 2011 introduction for general audiences; detector hardware has since evolved.
Open official film page ↗ (opens in a new tab)Follow a question into the next project.
These are starting points for further reading, not claims of institutional partnership with Stadia. An observation, a result and a mission under development are deliberately labelled differently.
Reported research result
Why does a galaxy stop forming stars?
Researchers from the Normale contributed to a Cambridge-led study of GS-10578, reported in January 2026, using Webb and ALMA. Compare what each instrument contributes before accepting a proposed explanation.[15]
Follow the research ↗ (opens in a new tab)Instrument / technology demonstration
What else is needed after blocking starlight?
Roman’s coronagraph combines masks and deformable mirrors to suppress stellar light. Explore the difference between a technology demonstration and a confirmed planetary discovery.[16]
Follow the research ↗ (opens in a new tab)Mission in development
Can we measure a change in spacetime?
LISA is being developed to track minute distance changes with laser interferometry between three spacecraft. It is a gravitational-wave experiment, not an ordinary camera.[17]
Follow the research ↗ (opens in a new tab)Mission in preparation
Why study the star to understand the planet?
Plato’s 26 cameras are designed to measure brightness variations for planet searches and stellar characterisation. Connect transits to the questions introduced in Chapter 1.[18]
Follow the research ↗ (opens in a new tab)Accelerator upgrade project
Why collect more collisions?
Larger collision datasets improve access to rare processes and precision tests. More data still require careful calibration, background models and uncertainty estimates.[19]
Follow the research ↗ (opens in a new tab)Instrument development
Can one camera design inform another mission?
CoCa, the Comet Camera for Comet Interceptor, builds on experience with CaSSIS while adapting the design to a different encounter. Reuse does not eliminate new requirements.
Follow the research ↗ (opens in a new tab)Six checks for scientific thinking.
Write your reason first. No account, score upload or personal information is needed.
1. A coronagraph image has a dark central disc. Has material disappeared?
No. The instrument deliberately blocks the bright central region. First distinguish the instrument’s effect from a change in the object.
2. A region appears blue in a Mars image. Is that sufficient evidence of liquid water?
No. First read the band selection and processing description. Colour mapping is not a direct chemical test. Compare independent measurements and alternative explanations.
3. A pulse takes 4 ms to return. Is the range 1,200 km?
No. That is the round-trip path length using the rounded classroom speed of light. The one-way range is 600 km.
4. Equal-charge ions have masses in a ratio of 4:1. Is the flight-time ratio 4:1?
Not in the simplified equal-voltage, equal-path model. Flight time scales as the square root of mass-to-charge ratio, giving 2:1.
5. Do CTAO mirrors collect gamma rays?
No. They collect Cherenkov light from atmospheric particle showers. Reconstruction connects that secondary signal to candidate high-energy events.
6. A coating looks unchanged after a test. Is qualification complete?
No. Appearance cannot establish all required optical, electrical, mechanical or environmental properties. Test the relevant functions against predefined criteria.
One chapter. Two classroom routes.
Prerequisites: percentages, units and basic ratios. The square-root derivation is optional. All assigned activities use the browser, paper or a safe indoor parallax demonstration. No solar viewing, lasers, vacuum work or electrical experiments are required.
Suggested exit ticket: “I used to think ____. The evidence or model showed ____. I still need to know ____.”
Use your browser’s Print command for a reading copy. Open the worked answers first to include them. For a paper-based activity, use the six questions in Test your understanding and the exit ticket above. A separate printable worksheet is available from the course organiser.
A small vocabulary for big questions.
- Coronagraph
- An instrument that suppresses a bright central source to reveal fainter surroundings.
- Bandpass filter
- An optical element designed to transmit a chosen wavelength interval.
- Calibration
- Determining how recorded signals relate to known reference quantities and conditions.
- Stereo imaging
- Using different viewing geometries to recover information about depth and relief.
- Exosphere
- A very tenuous outer gas environment in which collisions can be infrequent.
- Mass-to-charge ratio
- The particle mass divided by its electric charge; a key variable in mass spectrometry.
- Cherenkov light
- Radiation from a charged particle travelling faster than light’s phase velocity in a medium, not faster than light in vacuum.
- Uncertainty
- A quantified expression of the limits of a measurement, not simply a mistake.
- Technology transfer
- Adapting knowledge or a technology to another use, with new requirements and tests.
- Assigned / false colour
- A display mapping in which measured bands are represented by chosen visible colours.
Sources, image credits & reading notes.
Scientific explanations below are based on the linked public institutional sources and instrument-team work. Classroom numbers are explicitly synthetic. Mission plans are not treated as completed results.
- NASA Science. Wave Behaviors (opens in a new tab)Background: transmission, reflection, absorption and wavelength-dependent interactions.
- ESA / Metis team. Solar Orbiter’s first view of the Sun’s corona (opens in a new tab)Real observations, 2020; display colours are assigned to different wavelength bands.
- University of Bern. CaSSIS: instrument and mission (opens in a new tab)Mission identity and instrument context; distinguish the camera from gas-analysis instruments.
- ESA / CaSSIS team. Oyama Crater, Mars (opens in a new tab)Processed colour image, 13 June 2019; interpretation is supported by other instruments.
- A. Pommerol and colleagues. In-flight radiometric calibration of CaSSIS (opens in a new tab)Instrument-team paper, 2022. Four filters, framelets and calibration; not a beginner tutorial.
- University of Bern. BELA: experiment overview (opens in a new tab)Laser ranging, return-pulse detection, filtering and conversion from ranges into maps. Not a live mission-status page.
- ESA / BepiColombo. Hello Mercury (opens in a new tab)Monitoring-camera observation on 1 October 2021. Not a BELA measurement.
- University of Bern. NIM: Neutral and Ion Mass Spectrometer (opens in a new tab)Ion source, time-of-flight analyser and detector. Our classroom calculator is a simplified model, not a NIM simulator.
- ESA. Juice mission (opens in a new tab)Mission objectives; designed exploration of Jupiter and its icy moons. Mission schedules may change.
- CTAO. How CTAO Works (opens in a new tab)Air showers and Cherenkov-light detection. No claim that telescope mirrors reflect gamma rays.
- CERN. Upgrading the LHCb sub-detectors for the HL-LHC (opens in a new tab)RICH photon detection and timing; a different use of the same physical phenomenon.
- NASA Technical Reports Server. Transparent, Conductive Coatings Developed for Arc-Proof Solar Arrays (opens in a new tab)Historical research record, 1996. Example of optical and electrical requirements, not a TFP attribution.
- NASA Science. Infrared Waves (opens in a new tab)Infrared radiation and thermal imaging. Not all infrared observation is thermography.
- ESA / JANUS team. Juice JANUS view of Earth (opens in a new tab)Image of Luzon, 20 August 2024, acquired during instrument-performance evaluation.
- Scuola Normale Superiore. Pablo’s Galaxy: research with Webb and ALMA (opens in a new tab)Research reported 14 January 2026, involving the Normale and a Cambridge-led collaboration.
- NASA Science. Roman Coronagraph (opens in a new tab)Masks and deformable mirrors for starlight suppression; a technology-demonstration objective, not a claim of detected life.
- ESA. LISA (opens in a new tab)Mission in development; laser interferometry for gravitational-wave measurements.
- ESA. Plato (opens in a new tab)Mission in preparation; 26 cameras and measurements of stellar brightness variations.
- CERN. HiLumi LHC (opens in a new tab)Upgrade project and why larger datasets help investigate rare processes.
- NASA Science. Eclipse Viewing Safety (opens in a new tab)Safety source. No solar observation or laser experiment is assigned in this chapter.
- University of Bern. CaSSIS images and observation browser (opens in a new tab)Entry point for released images, films and observational data. The observation browser requires JavaScript.
- ESA. Planetary Science Archive: maximising science from our missions (opens in a new tab)Why calibrated data, documentation and archives matter.
CoCa further reading: University of Bern: Comet Camera (opens in a new tab).
Image provenance: the credit, original record and licence are attached to each image. Images are linked from their official hosts without colour alteration or relabelling. Artist’s impressions are marked. Remote hosting can change; a text link remains beside every figure. For educational/editorial use only where required by the licence; do not reuse these agency images in paid advertising without checking the relevant terms.
Independence: Stadia is an independent educational initiative. No endorsement, partnership, accredited course or review by the institutions mentioned is implied.
What would you measure?
Share this chapter with a class, an astronomy club or a curious friend. Choose one question and compare your reasoning before opening the answer.